
Global tech company and email service provider Campaign Monitor recently published an email marketing benchmarks guide. The guide aims to help email marketers from a wide range of industries increase the effectiveness of their campaigns.
Throughout this post, we’ll explore the guide’s most crucial data points.
Email Marketing Benchmarks 2019
Campaign Monitor analyzed over 30 billion emails that were sent through their email marketing tool. These emails are from 4.2 million campaigns sent by more than 20 industries in 2018.
Here are some of the most important data from Campaign Monitor’s comprehensive research.
- Benchmarks across all industries
- Average open rate - 17.92%.
- Average click-through rate (CTR) - 2.69%.
- Average click-to-open rate - 14.10%.
- Average unsubscribe rate - 0.17%.
- Average bounce rate - 1.06%.
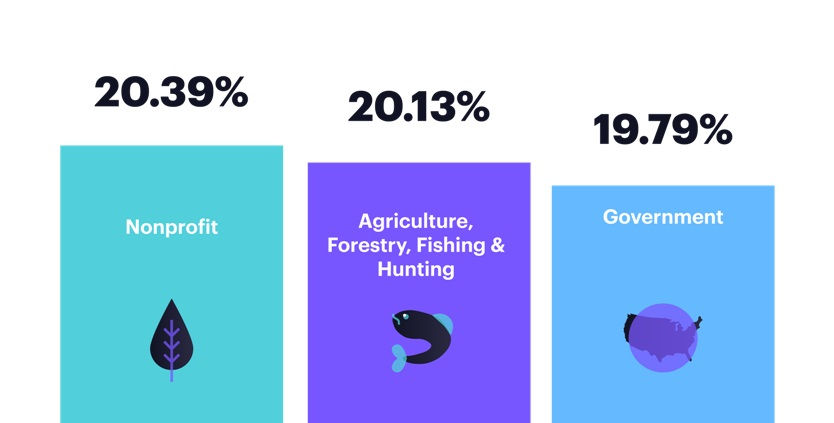
- Highest open rates (by industry)
- Nonprofit - 20.39%.
- Agriculture, forestry, fishing, and hunting - 20.13%.
- Government - 19.79%.
- Healthcare Services - 19.12%.
- Other - 18.94%.
- Lowest open rates (by industry)
- Consumer packaged goods - 14.53%.
- Retail - 14.98%.
- Food and beverage 15.48%.
- Travel, Hospitality, and Leisure - 16.62%.
- Automotive and aerospace - 17.35%.
- Highest click-to-open rates (by industry)
- Agriculture, forestry, fishing, and hunting - 18.03%.
- Media, entertainment, and publishing - 17.15%.
- Real estate, design, and construction activities - 16.47%.
- Unknown - 15.52%.
- Government - 15.11%.
- Highest click-through rates (by industry)
- Agriculture, forestry, fishing, and hunting - 3.66%.
- Real estate, design, and construction activities - 3.06%.
- Government - 3.04%.
- Media, entertainment, and publishing - 3.02%.
- Education - 2.82%.
- Lowest click-through rates (by industry)
- Food and beverage - 1.69%.
- Consumer packaged goods - 1.86%.
- Real estate agents and brokers - 2.02%.
- Travel, hospitality, and leisure - 2.14%.
- Automotive and aerospace - 2.17%.
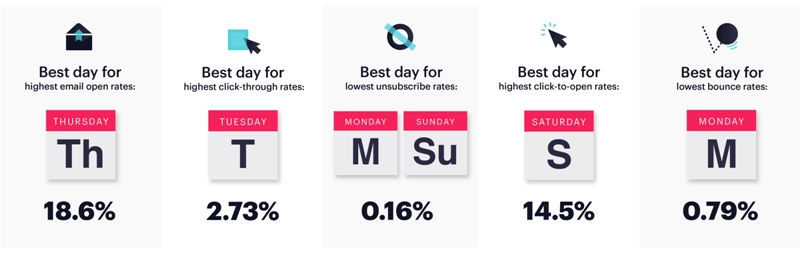
- Best days for email marketing
- Day with the highest open rates - Thursday.
- Day with the highest click-through rates - Tuesday .
- Day with the highest click-to-open rates - Saturday.
- Day with the lowest unsubscribe rates - Sunday or Monday.
- Day with the lowest bounce rates - Monday.
- Worst days for email marketing
- Day with the lowest open rates - Sunday.
- Day with the lowest click-through rates - Sunday.
- Day with the lowest click-to-open rates - Monday.
- Day with the highest unsubscribe rates - Wednesday.
- Day with the highest bounce rates - Friday.
Why Look at Email Marketing Benchmark Data?
When email marketers want to check their email marketing performance, they usually refer to their email marketing tool and analyze their own data. What many email marketers don’t take into account is that benchmark data is also useful in determining email performance.
While analytics is indispensable to any email marketing strategy, it only provides you with a narrow view of your email marketing health. In contrast, looking at benchmarks gives you a holistic view of email marketing and allows you to compare your own data with industry standards.
With an understanding of how your email performance stacks up against others, you’ll immediately know whether you are performing better or worse. You can then use this information to determine which areas of your email marketing need improvement.
Leveraging benchmark data to boost your email marketing performance
Here are some helpful tips on how you can use benchmarks to boost your email marketing metric by metric.
- Open rate
Your open rate is the percentage of subscribers (out of the total number) who opened an email campaign. According to current benchmarks, the average open rate is 17.92%.
The most effective way to increase your open rates is optimizing your email subject lines. Write subject lines in such a way that you make the best possible first impression on your subscribers.
Use incentivizing language on your subject lines to grab attention. Include words like on sale now, % off on orders over, limited time, or back in stock.
Make sure you also include your subscriber’s first name in the subject line. Emails with personalized subject lines are 26% more likely to be opened.
- Click-through rate (CTR)
Your click-through rate is the percentage of subscribers who click on a link within your email. CTR is calculated using the total number of emails, so it’s much lower than your click-to-open rate. Benchmarks indicate the average click-through rate to be 2.69%
Here’s how you can improve your CTR:
- Segment your subscribers by age, geographical location, gender, and behavior. This way, you can send each segment the content that is most relevant to them.
- Optimize the design and copy of your calls-to-action (CTAs). Use CTA buttons instead of plain hypertext links.
- A/B test different CTA varieties.
- Click-to-open rate
Your click-to-open rate is the percentage of subscribers who opened your email and also clicked on a link within the email. In contrast to CTR, the click-to-open rate only considers subscribers who opened your email.
Per email marketing benchmarks, the average click-to-open rate is 14.10%.
To improve your click-to-open rates, you need to:
- Optimize your emails so that they render perfectly on any device. You can ensure this by using responsive email templates that are already optimized for viewing on mobile devices.
- Include a prominent CTA that stands out. Make the CTA button large enough that they can still be easily tapped on mobile devices.
- Segment your list and send targeted offers.
- Unsubscribe rate
Your unsubscribe rate is the percentage of subscribers who opt-out of receiving future emails from you. The average unsubscribe rate is 0.17%.
Although unsubscribe rates among industries is low, you should still make a conscious effort to prevent your subscribers from opting out.
You can avoid high unsubscribe rates by keeping your list healthy from the beginning. Never, under any circumstances, purchase lists from third parties. Furthermore, don’t be afraid to remove disengaged subscribers from your list.
That being said, you should remember that losing a small portion of your subscribers each year is normal and unavoidable. The best way to minimize this is to engage with your existing subscribers.
- Bounce rate
Your bounce rate is the percentage of emails that were not delivered to their intended recipients. The average bounce rate is 1.06%
You can avoid high bounce rates by:
- Always using the confirmed opt-in method when adding subscribers to your list
- Immediately deleting invalid email addresses from your list
- Avoiding content that triggers spam filters
- Suppressing previous bounces
Wrap Up
Hopefully, learning a wide range of benchmark data gives you a concrete idea about how your emails are currently performing in comparison to your industry as well as others. If you think you’re performing below average, follow the advice mentioned here for your next campaign.
You can also read more about email marketing benchmarks by checking out Campaign Monitor’s Email Marketing Benchmarks Guide for 2019.