When you turn your PDFs into digital flipbooks with FlippingBook, you get a great opportunity to track how your content performs and enhance it to get better results, all thanks to our smart built-in analytics.
Today, we’re excited to share our latest update that we’ve been working on for quite some time—Enhanced Document Stats. We’ve added three new useful metrics in the Flipbook Performance section. Plus, you can now choose how to group your data to get deeper insights into how your audience interacts with your content, export your data in a convenient format, and more. Let’s see what’s new right away!
Check Out Three Cool New Stats
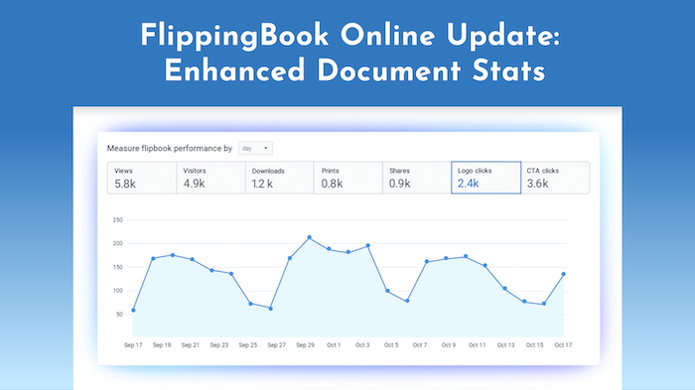
Now, in your Flipbook Performance section, along with Views, Visitors, Downloads, and Prints, you can track the following three new stats:
We’ve been collecting the new stats since October 27, 2022
Share—shows the number of times the Share dialog was opened. This metric helps you understand if readers find your content useful and worth sharing with others.
Logo clicks—the number of times the readers clicked on the logo in your flipbook. These stats show if people are interested to learn more about your brand after reading your flipbook. Plus, logo clicks will allow you to measure traffic from your flipbook to your website.
CTA clicks—the number of times the readers clicked on the call-to-action button in your flipbook. It’s a button that can lead to any website or landing page of your choice. This metric allows you to check if your CTA is engaging and if readers want to act on it.
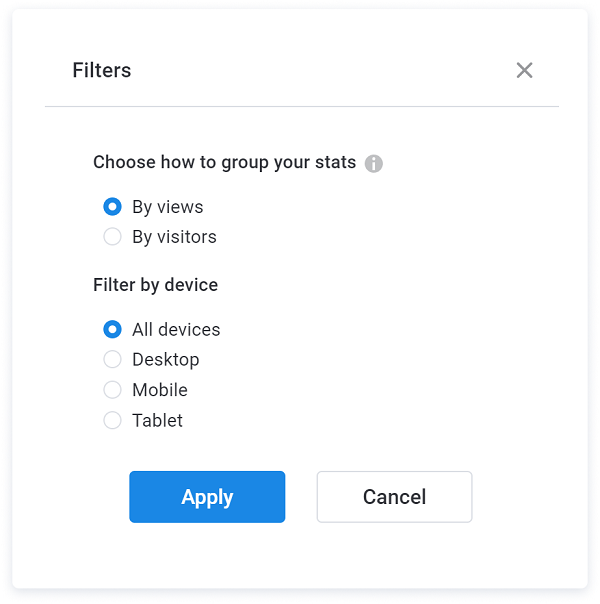
Choose How to Group Your Stats
You can now choose how to group your stats: based on the total views your flipbook got or by analyzing how an average unique visitor interacted with your flipbook. When grouping by views, you see the number of times a visitor viewed your flipbook when interacting with the flipbook.
Where a single visitor might view your flipbook several times, multiple other visitors might view it only once, so how can you understand the stats? Here’s an example of how it works:
For instance, one visitor opened your flipbook once and clicked on your logo once, while another visitor opened your flipbook 3 times and clicked on your logo each time. So grouping by views will show you 4 logo clicks, because there were 4 views with a logo click. But grouping by visitors will only show you 2 clicks, because only 2 unique visitors clicked on your logo.
These filters are applied to the Flipbook performance, Audience engagement, and Search queries sections, and are not applied to the Collected leads section. When you group the stats, they're adjusted to a time period that you select (day, week, or month).
So what are the metrics you can filter and group from now on? Here are the main 7 helpful stats in your Flipbook Performance section that bring you insights into your content:
Views, Visitors, Downloads, Shares, Prints, Logo clicks, CTA clicks
What’s more, you can also look at the performance of each page of your flipbook individually to analyze which pages are especially interesting to your readers and which ones need some improvement. These 3 metrics can be found in the Audience engagement section:
Pages viewed, Time spent, Links clicked
And last but not the least, if you want to know what people are searching for in your flipbook to understand their needs, you can go to the Search queries section.
Export Your Data in the Most Convenient Way
You can choose the format to export your data: Excel or CSV. In the Excel format your data will be shown in columns, so you will be able to open the file in Excel and work with it right away without additional actions. This format is ideal for marketers. And CSV comes in handy if you want to export your file to other systems, for example, any CRM or email tools, or parse the data. What’s more, a CSV file has a smaller size than an Excel one. Thus, this format is great for analysts who work with large amounts of data.
Please note that data export is available in Starter and above.
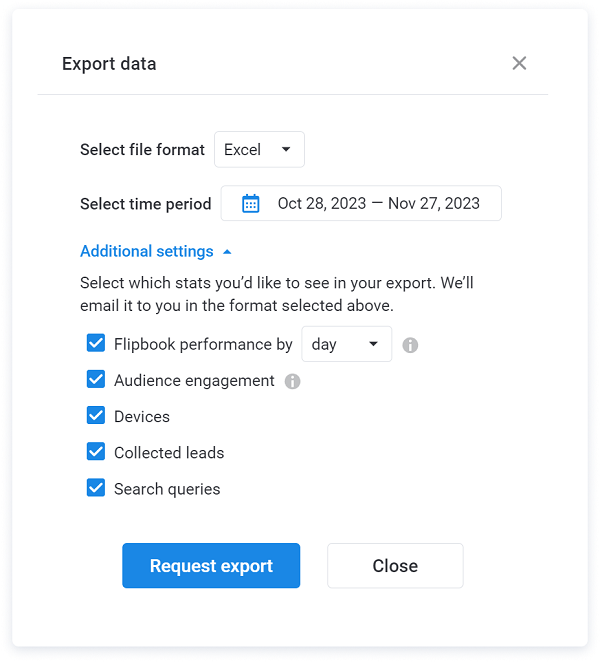
Plus, we’ve refreshed the look of the Export data dialog window and the email with the export data that you get. This email contains links to the Excel file or a zip file with the requested CSV files with your data.
And More…
Introduction to devices. We’ve changed the way we detect the type of device your audience opens your trackable link on. Now devices are detected as Desktop, Mobile, or Tablet.
Plus, we’ve made some under-the-hood improvements to the stats analysis to make everything work even better.
Stay Tuned for Future Updates
We’re already working on many exciting future updates for the next releases, here’s what’s coming your way.
New weekly stats report. We’ll refresh the design of your weekly stats email and add new functionality. All the top stats will be covered in the weekly report, including your best-performing flipbook. You'll see some tips and tricks in there too!
Devices stats. You’ll be able to learn what devices your readers view your content on—desktops, phones, or tablets. Knowing this data, you can optimize your content for better viewing on different devices.
Geolocation stats. You’ll be able to see where your visitors come from, and which region delivers the most views. Thus you can adjust your content to your specific audience, their interests and time zones (for email campaigns).
Also, your View stats page and the rest of the account will soon experience a redesign. New colors but same functions and position! We just wanted to give you a treat—a fresh look for the product you know and love.
We hope that our new stats will help you get even more actionable data to empower your content and understand your audience. Check the new updates in your account right away.
Learn about FlippingBook's latest updates in our Release Notes flipbook.