Getting relevant information from the Developer Tools / Web Inspector console
An issue with your FlippingBook publication may sometimes occur unexpectedly when the publication is already up and running online.
Even though there is no visible error message at all, it is still possible to ascertain where the problem might be coming from. If your flipbook is available publicly, then we will probably be able to understand the issue ourselves as long as you provide us with the link.
However, if your flipbook is hosted on a private server that we can’t access, then we would need to see screenshots of the Developer Tools (Web Inspector - in Safari) console.
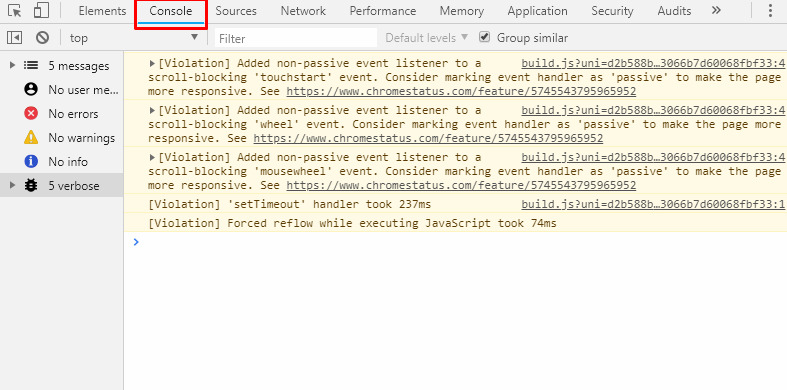
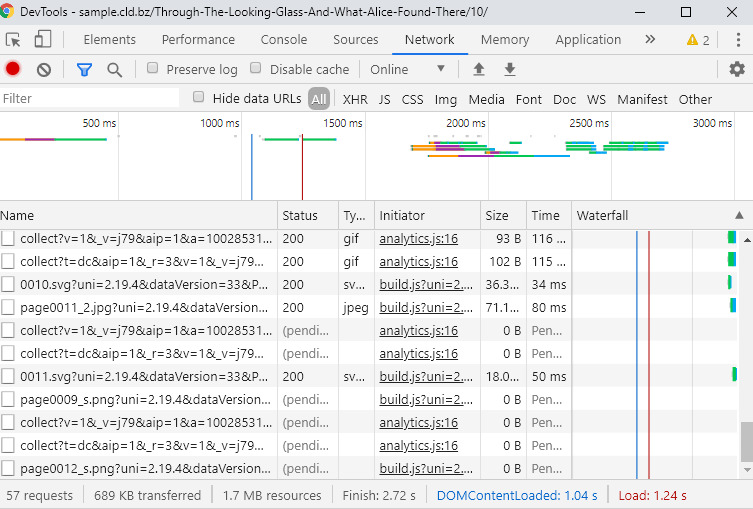
The look of this console can differ from browser to browser, yet its main elements stay relatively the same – the tabs called Elements, Console, Sources, Network, Performance, and so on.
Normally, we would only need screenshots of the contents in the tabs Console and Network, but sometimes in the Emulation tab in Internet Explorer as well.
Please follow these steps:
- Open your publication in your browser
- Open the Developer Tools console as follows:
- In Chrome, Firefox, Internet Explorer, Microsoft Edge: press [F12]
- In Opera: press [Ctrl] + [Shift] + [I]
- In Safari: press [Command] + [Option] + [I]
- Open the Console tab and take a screenshot of the contents.

- Open the Network tab, but don’t screenshot it yet. It may not contain all the information we need.
- Refresh the page, scroll all the way down to the latest entry in the Network tab and only then take a screenshot of the page.

- Send us both screenshots.