

 FlippingBook Publisher
 FlippingBook Automation
 Salespal
What can I track with my Stats page?
 Product: FlippingBook Online
FlippingBook Online's built-in analytics is an easy-to-use yet powerful tool to evaluate the performance of your flipbooks. We show the views that your flipbooks received in total on the main page. More detailed statistics for your flipbook can be found on the Stats page. Depending on your plan, you can even see how your audience interacts with your content. You will also find leads that you collect with the Lead capture form here. And you can export all your data!
Note!Stats do not allow you to identify your readers on an individual level. If you wish to track particular readers, you can use trackable links to do that.
Keep on reading if you would like to learn how to:
- Open the Stats page
- Specify the period for which to display statistics
- Grouping and understanding your stats
- Analyze Flipbook performance
- Track Audience engagement
- See which Devices were used
- Check where your visitors came from
- See your Collected leads
- What readers searched for
- Export data
- Availability of your stats
- Do you need even more stats?
That's a lot of information! Prefer a real person to show you how it works? Book a meeting with one of our specialists!
Open the Stats page
- Open the list of your flipbooks in your online account.
- Hover over the flipbook which you want to check and click on the button with three dots.
Choose the View Stats option from the menu
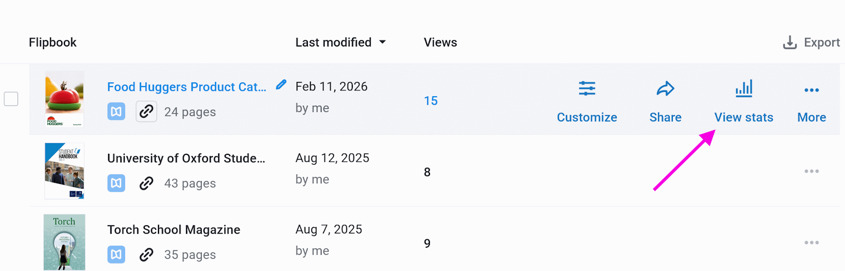
You will now be taken to the Stats page where you can see the analytics data for your flipbook.
Note! If you don’t see some recent user activity reflected in stats, please, wait a bit. It might take up to 5 minutes for the data to be updated.
Specify the time period for your statistics
The stats page shows the data for the time period specified at the top. The default period is one month, but you can select dates for a different time interval in the pop-up calendar:
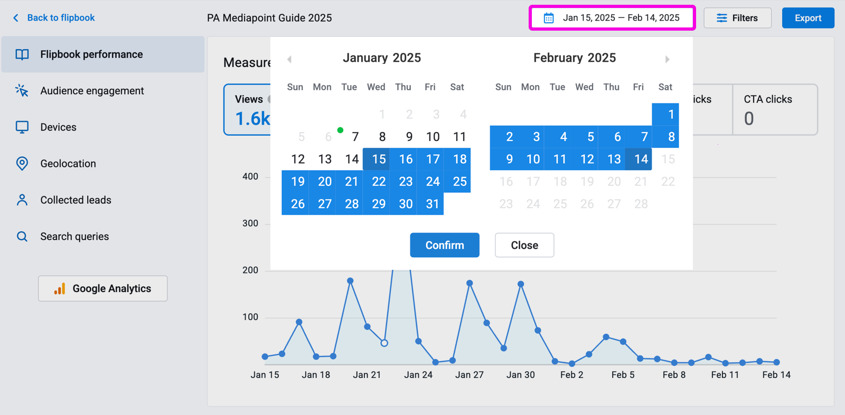
- Click in the date field.
- First, click on the day that you want to use as the first day of your reporting interval.
- Then click on the day that you want to use as the last day of your reporting interval.
- Press the Confirm button.
Analytics data history is only available for a certain period of time, depending on your plan.
• 30 days for the Lite and Starter
• 1 year for the Optimal
• 2 years for the Advanced, Team and Enterprise
If you need a longer period of time, you can always export data from your online account and store it elsewhere.
Group and understand your statistics
Readers often return to a flipbook more than once, which means the same person can generate multiple views and actions (such as logo clicks or prints). To account for this, you can group your statistics by views or visitors. You can then analyze either how often actions occur or how many individual readers perform them.
You can set this in the Filters menu.
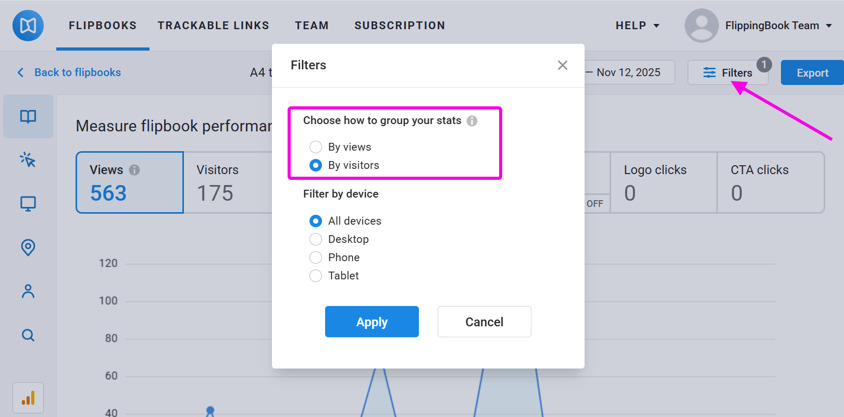
Group by views
When you group statistics by views, each visit is counted separately. One visit means the time from the moment someone opens your flipbook until they close it.
This grouping is useful for understanding how readers engage with your flipbook each time they open it and for measuring the performance of individual visits.
If the same person opens your flipbook multiple times, each visit is treated as a new view. Actions such as downloads, prints, CTA clicks, and page views are counted once per visit, even if the reader performs the same action multiple times during that visit.
Group by visitors
When you group statistics by visitors, the results are based on unique readers rather than individual visits.
This grouping is useful when you want to understand how many individual readers performed a specific action instead of how often it happened.
If the same person visits your flipbook several times, they're counted only as a single visitor. Likewise, actions such as prints, CTA clicks, and page views are counted once per visitor, irregardless of how many times they did it.
The only exception is views, which always shows the total number of visits.
Flipbook performance
After you specified your reporting interval, you can evaluate your flipbook performance. The following stats will be adjusted to the selected period of time:
- Views - shows the total number of times your flipbook link was opened.
- Visitors - the total number of different visitors that opened your flipbook link.
- Downloads - the number of visits in which the visitor downloaded your PDF, accessible PDF, or a separate page at least once.
- Shares - the number of times people opened the Share dialog using the desktop share icon.
- Prints - the number of visits in which the visitor printed at least one page.
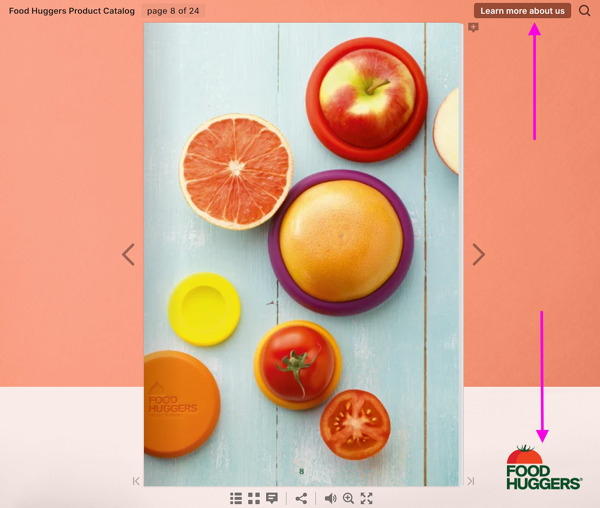
- Logo clicks - the number of times people clicked on your logo in the bottom-right corner of your flipbooks.
- CTA clicks - the number of times people clicked on your Call to Action button.
Let's look at them in a bit more detail.
Views and visitors
A single visitor can generate multiple views by opening the flipbook several times. For example, John opens your flipbook on Monday and he views it again on Tuesday. Mary opens your flipbook on Tuesday. This means that there are 3 views and 2 visitors.
If the number of views and visitors is the same, it means that the readers never return to the flipbook. If the number of views is considerably higher than the number of visitors, that's a signal of many returning visitors.
The data is visualized using line graphs which makes it easy to see the trends within the specified period. You can select Day, Week, or Month from the drop-down list above the graph to see data by day, week, or month.
You can switch between the Views, Visitors, Downloads, Shares, Prints, Logo clicks, and CTA clicks graphs by clicking on the corresponding areas above the graph.
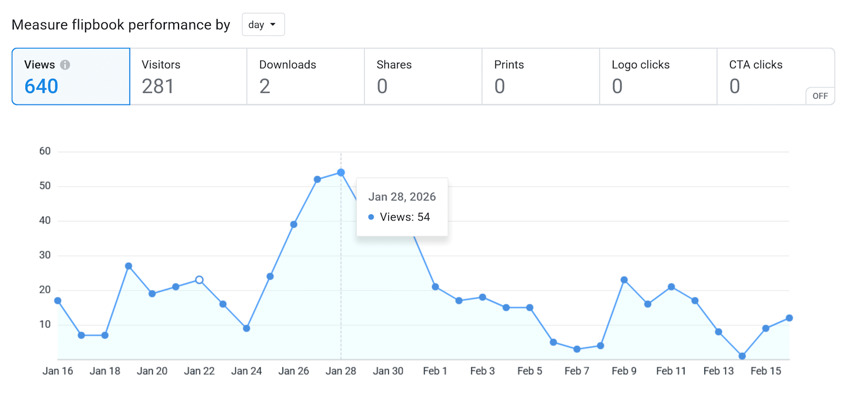
In our example above, we selected a period from January 16 to February 16 and chose to analyze performance by Day.
- The total number of views for the whole period is 640.
- If you want to know the exact number of views during a particular day, you can hover over the graph. This brings up a tooltip. On January 28, our flipbook got 54 views.
- Note that the dot on the blue line is sometimes open, such as the dot on January 22 in the screenshot. This indicates that you updated the flipbook that day.
- We can see that the total number of views (640) is larger than the total number of visitors (281). That means that 359 views were generated by returning visitors.
- For longer periods, you can group data by week or month to get a clearer picture of trends over time. Below, in another flipbook, we look at a 3-month interval and set the Measure flipbook performance by to Week.
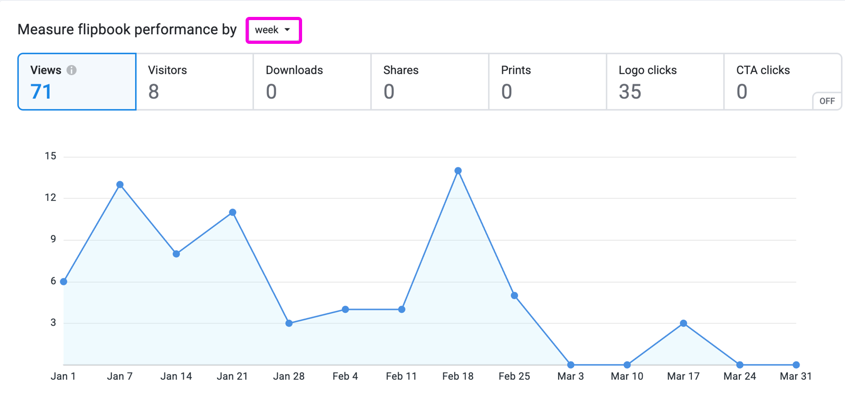
Attention! If you click on Visitors in the panel, you will see the number of unique visitors over the selected period. The graph shows the number of unique visitors on that day. If you add up all the visitors per day, the result may differ from the visitors over the total period! This sounds weird but is quite logical.
For example, both John and Mary visit your flipbook on Monday. John views it again on Tuesday. If you look at the visitors from the whole week there are 2 visitors (John and Mary). In the graph, you will see 2 visitors on Monday (John and Mary) and 1 visitor on Tuesday (John)
Downloads and Prints
Clicking on the Downloads and Prints sections will show the number of downloads per day, week, or month over the selected interval.
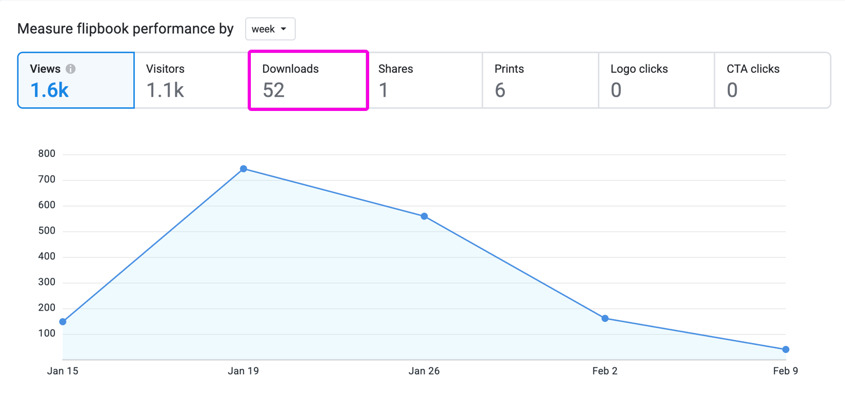
Every time a reader views your flipbook and downloads or prints multiple times in the one session, we only count that as one download/print.
NoteIf you disabled the download and/or print functions, you will see the word OFF in the bottom right corner. Clicking on that will bring up a link that takes you to the customizer where you can enable/disable the print and download options for your flipbook.
Shares
The Shares section shows how often readers clicked the Share icon on the desktop. This is only an indication of sharing activity, since readers can share your flipbook in other ways and the icon isn’t available on mobile phones. You can use it to identify trends or compare sharing activity between flipbooks.
Logo clicks and CTA clicks
Audience Engagement
These Advanced stats are only available in Advanced, Team, and Enterprise plans.
It's not just possible to evaluate the performance of your flipbook as a whole. You can also look at the performance of each page of your flipbook individually. A useful tool to learn about drop-off points in your publication, and about pages that are especially interesting to your readers. The Audience engagement section shows:
- Pages viewed - how many pages your average visitor viewed and how often each individual page was viewed.
- Time spent - the average time spent on pages of your flipbook during the specified period.
- Links clicked - the total number of clicks on external links within your flipbook during the specified period.
You can switch between the Pages viewed, Time spent, and Links clicked stats by clicking on the corresponding area in the header. Let's look at each of them in detail.
Pages viewed
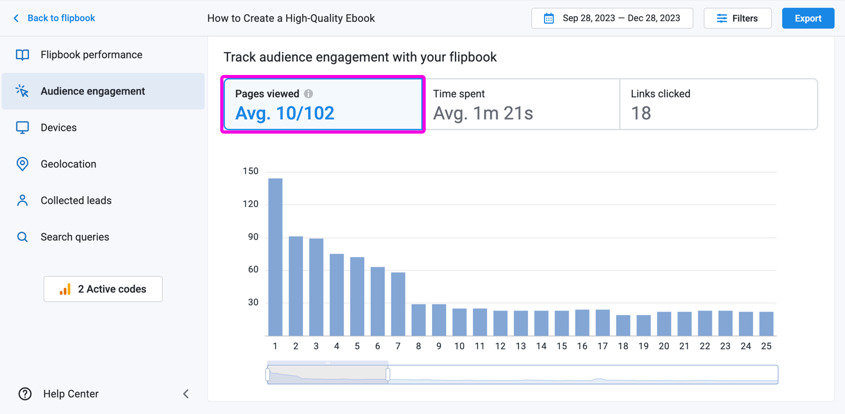
Above the chart, you can see the average number of pages viewed per visit. In the example above, we see that on average, 10 pages of our 102-page book were viewed per visit.
The bar chart shows the individual pages in your flipbook on the horizontal axis. The columns represent the number of views that each page got. You can hover over the column of a specific page. This brings up a small thumbnail that reminds you of what this specific page is about. This pop-up also shows the exact number of views for the page.
Note!Embedded flipbooks: every time someone opens a webpage with your embedded flipbook, its first page automatically gets a view.
Note! When someone views your flipbook on a desktop, they will see two pages at once. We don't know which of those pages they are actually looking at. Therefore, we add half of the actual viewing time' for both of them. For example, if someone looks at pages 4-5 for 10 seconds, then both pages get 1 page view and 5 seconds of viewing time.
But if a book is viewed on mobile in Portrait (vertical) then it's displayed as single pages. In this case, only the viewed page is counted for the full viewed time.
If you set the grouping to visitors, then this data changes as follows:
- The Pages Viewed Avg. in the header will show how many pages your average visitor viewed.
- The graph itself will show the number of unique visitors that viewed the specific page.
Time spent
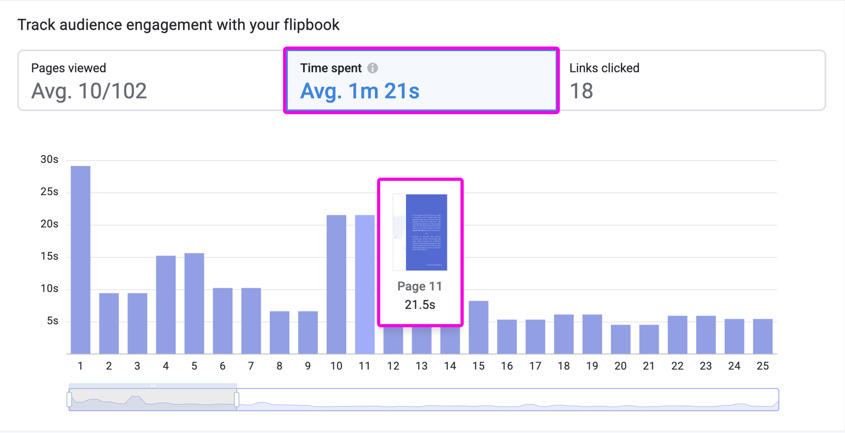
Now let's look at the time spent. The time spent in the header shows how long your average viewing session lasted on the flipbook as a whole. In our example, the average viewing time for the whole book was 1 minute and 21 seconds. You can hover your mouse over each page to see how much time the reader spent on it.
Note!The last page can sometimes have a surprisingly high viewing time. This is because users may leave the flipbook open on the last page and return to close it several hours later. While this can happen on any page, it’s particularly common on the last one. To prevent this from skewing the average viewing time, we stop recording session stats on a page after 5 minutes.
If you set the grouping to visitors, then this data changes as follows:
- The Time spent Avg. in the header will show how much time your average visitor spent looking at your book.
- The graph itself will show the average time per visitor spent viewing the specific page.
Links clicked
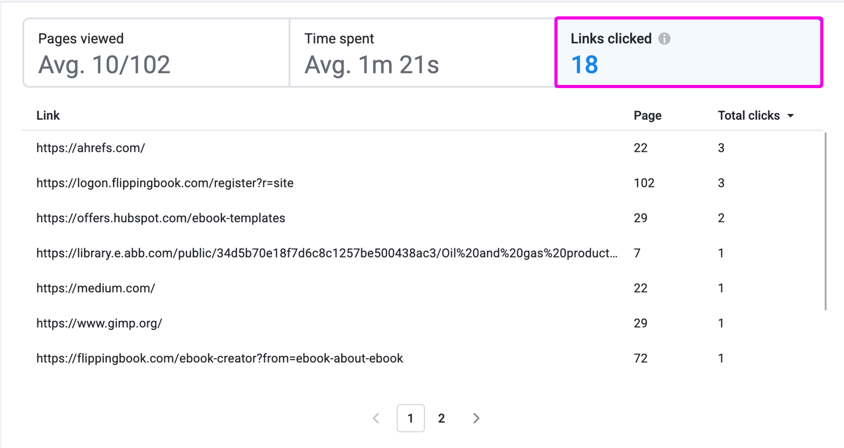
Above the table, you can see the total number of times your readers clicked on links in your flipbook. The table itself shows the details: which link on what page was clicked, and how many total clicks it got. You can sort the table by Page or by Total clicks by clicking on the header.
In our example, there were 18 external links clicked during the period from September 28th - December 28th. Important to note:
- we only count links to other sites, not internal links to other pages in your flipbook.
- If a visitor clicks the same link more than once during a single visit, we only count it as 1 click.
Note! Only links that were actually clicked on show up in this report, If you have other links in your flipbook that do not appear in the table, it means that nobody clicked on them.
If you set the grouping to visitors, then this data changes as follows:
- The Links clicked in the header will show how many different visitors clicked on links in your flipbook.
- The table will show how many unique visitors clicked on the link.
Device usage
The devices block simply shows you what kind of device your visitor used to view your flipbook: a desktop computer, a tablet, or a phone.
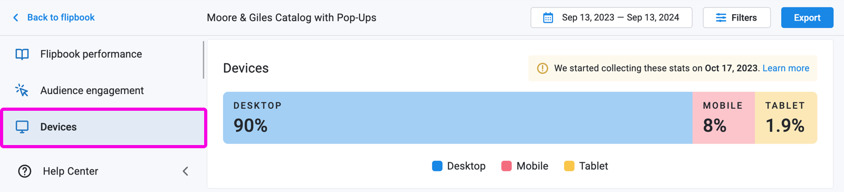
This is useful to know in itself. If you see that the vast majority of visitors use phones, then you may want to double-check how your content looks on phones and consider some optimizations. For example: you could consider additional links for easier navigation or a bigger font for easier reading.
But what’s more, you can also filter by device type. That’s especially useful to see the differences in behavior by e.g. desktop and mobile users.
Click on the Filters button near the top right corner.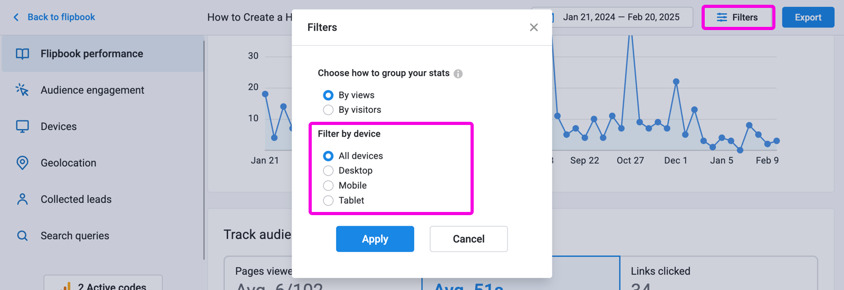
- Select which devices you want to see in your report: Desktop, Mobile, Tablet, or All.
- Click Apply
Check where your visitors came from
The Geolocation is only available in Advanced, Team and Enterprise plans.
The Geolocation block is available starting from FlippingBook Online Advanced and higher. It shows you what countries, regions, or cities your visitors came from:
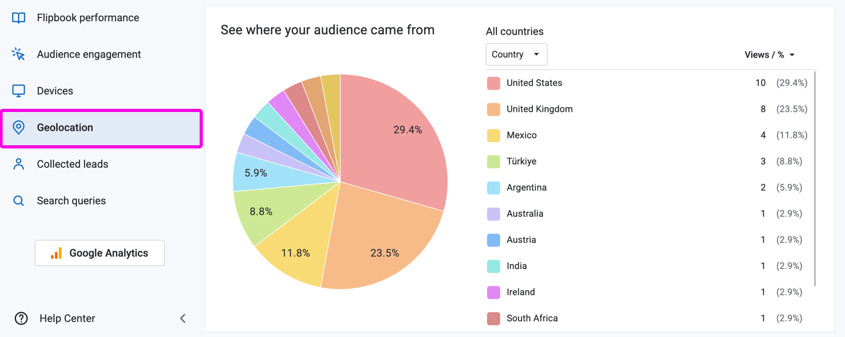
This block will be useful if you need to know the leading locations and then want to keep track of trends, and possibly adapt flipbooks to local markets.
By default, you see a list of countries and the number of views per country on the right side of the block. But if all your visitors come from one country, the Geolocation block will skip the Country and immediately show the regions. If all visits are from the same region, only cities will be shown.
You will also see a pie chart showing the percentage of views per country on the left side of the block. It will show you the countries that visit your flipbook the most. Countries with the least views can appear in a separate grey section of the pie chart called Others.
If you hover over a section in the pie chart, it highlights the corresponding line in the list:
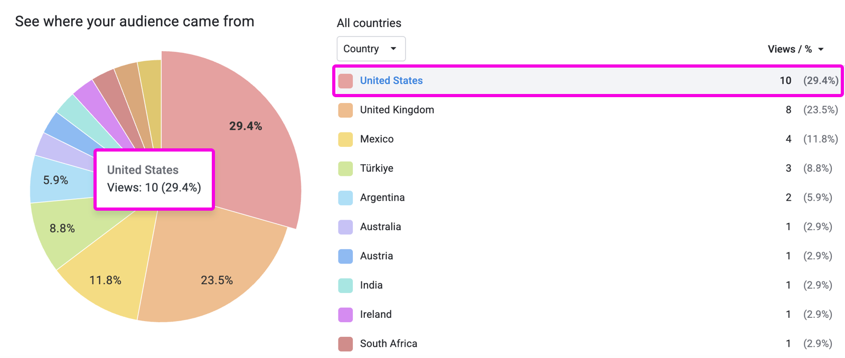
If you click on a country in the list, you will see a breakdown of the traffic in that country by regional level (state, province, or territory). When you click on a region, it opens a list of cities where your readers viewed your flipbook.
Warning!⚠️
All locations are based on (anonymized) IP addresses. This technology is not very precise, and deviations can occur, especially at the region and city levels. Use these stats as a general indication rather than an exact distribution!
Kindly note that if for some reason it was impossible to determine the country, region, or city, they appear in the list as Unknown.
You can also open regions and cities by using the drop-down menu located above the countries’ list: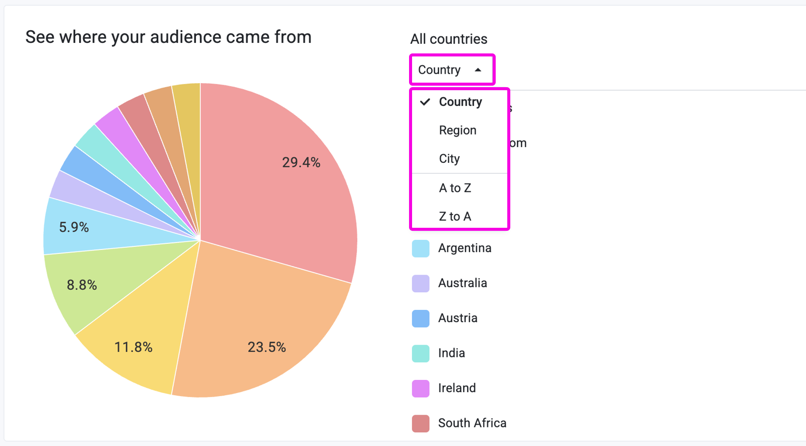
Depending on what kind of location you want to see for your flipbook, you can choose Country, Region, or City in alphabetical or reverse alphabetical order.
It’s also possible to sort your locations by Views, but this way your previous filters will be removed.
Tip💡The Geolocation by default shows the number of Views your book got. A single visitor can make several views. Interested in the number of visitors instead? Change the grouping of data in the Filters menu, located in the top-right corner.
See the collected leads
The lead capture form and its stats are not available in Lite and Starter plans.
With FlippingBook Online Optimal and higher plans, you can set up a lead capture form. You can use this to ask your readers to leave their name, email address, and other data. If you have a lead capture form in your flipbook, you will find the leads collected during the specified period in the Collected Leads section of the Stats page.
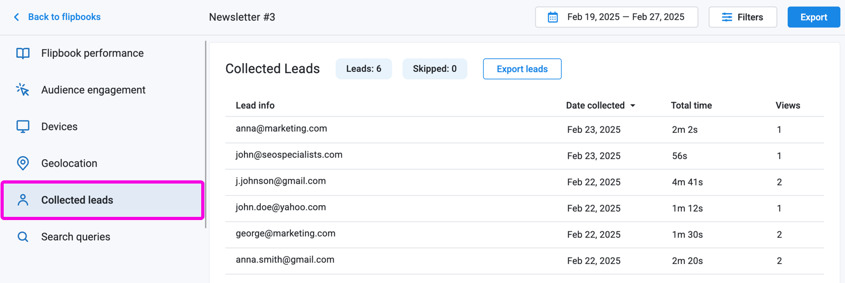
In the header, you see the number of
- Leads - this is the number of visitors who filled out at least one field in the lead capture form.
- Skipped - this is the number of people who skipped the lead capture form (or who submitted without entering any data if you don't make any fields required).
For each lead you can see the following information:
- Lead info - first name, last name, and email address. If you use the lead capture form to capture additional data, then a line with More appears. Click on it to unfold the additional data.
- Date collected - the date when the lead was collected.
- Total time - the total amount of time that this lead spent reading this flipbook during the selected period.
- Views - the number of times the lead opened your flipbook during the selected period.
You can easily export your leads as an Excel or CSV file by clicking the Export leads button. With the Advanced and higher plans, you can also use the Zapier integration feature to automatically send your leads to a different application.
Search queries
Your readers can search in your flipbooks using the built-in search function 🔎︎. You can find out which words they were looking for exactly. To do so, simply select the Search queries from the panel on the left-hand side. You will then see the Keywords that were searched for and the Number of queries made for that keyword.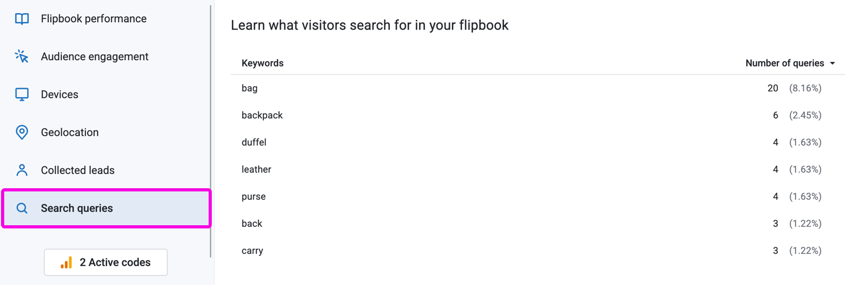
Useful to know:
- The Number of queries shows the number of visits during which a keyword was searched for. session and one from today’s.
- The table displays all completed searches, successful and unsuccessful. So even if someone searched for a word not present in your book, it will still show up here.
Tip 💡We recommend using the maximum reporting interval when looking at search queries. The number of results will probably be limited. Moreover, what people search for will in most cases not depend on a specific period. Therefore, selecting a longer interval will give you a better general idea of what people search for.
Export data
Data export is not available in Lite plan.
You can export analytics history data and collected leads as an Excel or as a CSV file. To export the data, press the Export button at the top of the Stats page. In the pop-up window, select the desired file format and period for the data you wish to include:
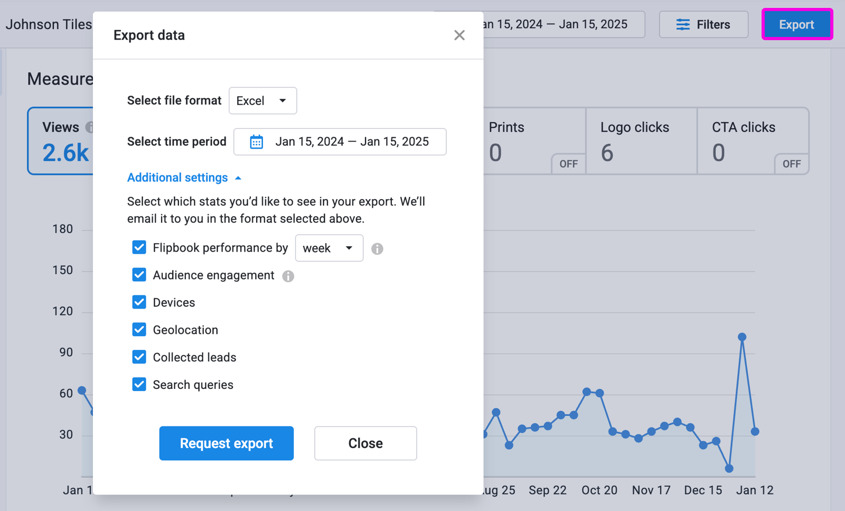
This report will always contain your Flipbook performance stats. You can open the Additional settings to specify how we group the performance stats: by day, week, or month.
You can also indicate if the report should contain:
- the Audience engagement stats for page-level data - how many views and visitors each page had, how long they stayed on that page, and links clicked (available in Advanced and higher)
- where your visitors came from (available in Advanced and higher)
- collected leads (available in Optimal and higher)
- search queries
When you are ready, press the Export button. We will send an email to your account email address. This email contains links to the Excel file or a zip file with the requested CSV files with your data.
Availability of your statistics
The number of views a flipbook received since its creation will always be available on your main page. We started collecting these in November 2019, so in the rare case that your flipbook was created before that, please that keep in mind. These are views since November 2019.
We store the more detailed flipbook stats that you see on the Stats page for 2 years, but the actual time range you can select depends on your plan.
- Lite and Starter: 30 days before today.
- Optimal: 1 year before today.
- Advanced and higher plans: 2 years before today.
If you need statistics for a longer period of time, you can consider upgrading to a higher plan with longer availability. As said, we keep data available for 2 years, so if you upgrade, your historical data will immediately become available in your account. Alternatively, you could regularly export the data from your online account and add it to, for example, a spreadsheet.
Some stats that are available now have not always been collected.
- Shares have been collected since October 27, 2022
- Logo clicks have been collected since October 27, 2022
- CTA clicks have been collected since October 27, 2022
- Devices used have been collected since October 17, 2023
- Where your visitors came from have been collected since January 1st, 2023
Do you want even more stats?
So, as you can see, with FlippingBook Online you can track statistics for each individual flipbook. Want to export data for all your flipbooks at once? That’s possible too—check out our article Exporting Reports for your Flipbooks to learn how.
If you need more in-depth analytic data than the FlippingBook Online built-in statistics can provide, you can also set up Google Analytics for your flipbooks. A small warning though: Google Analytics provides a wealth of things you can track, but it is not the easiest tool to use and has a pretty steep learning curve.


