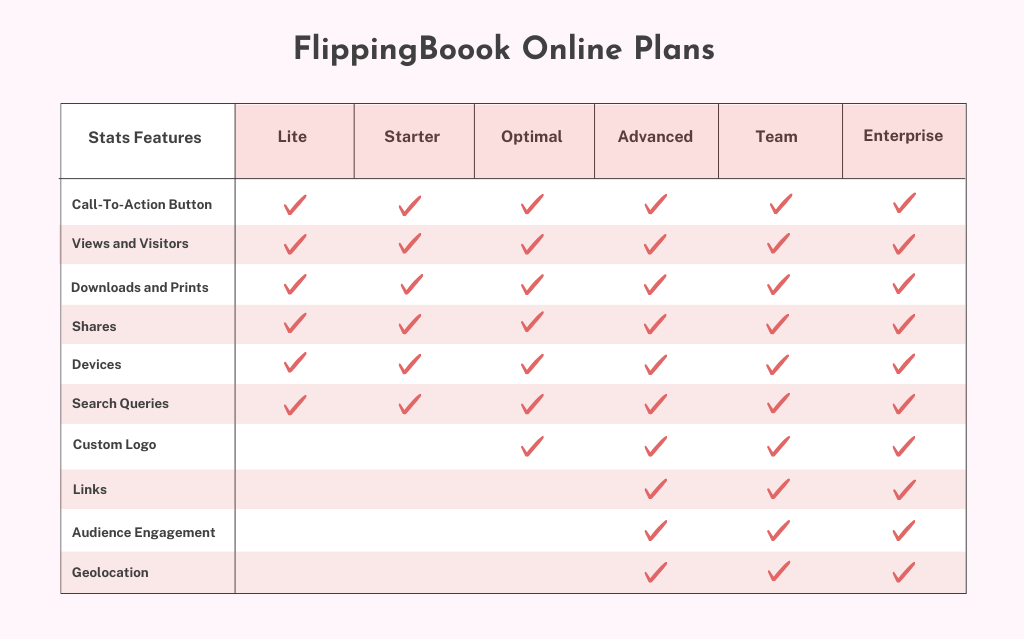
When you start creating flipbooks with FlippingBook, you get a set of powerful features that help you achieve the best results with your content. So today let’s talk about one of such features—FlippingBook Online's built-in statistics, and how to use it to the fullest to enhance your flipbooks and connect with your audience better. We’ll walk you through each of the stats from the Stats page in your account and describe what actionable data and benefits you can get from them. We’ll start with the ones that have some hidden value that you might not see right away. First, check out what stats features you can find in FlippingBook Online plans.
You can watch the video on how to track your documents with FlippingBook or read on to learn everything in more detail.
 #1 Logo
Logo clicks show the number of times that someone clicked on the logo per day, week, or month over the selected interval.
Logo can generate a lot of traffic to your website, so we definitely recommend changing FlippingBook's default logo to yours in your flipbook. This way, if your visitors want to learn more about your business after reading your flipbook, they can do it right away by clicking on the logo. Plus, adding your company’s logo helps you raise your brand awareness and keep consistency across all of the channels.
Adding a custom logo is available in the Optimal plan and higher. Read our Help Center article to learn how to change a logo in a few simple steps.
Check out how bright and engaging a logo can look in a booklet.
Create yours
 #2 Call-To-Action Button (CTA)
CTA clicks show how often your visitors clicked on the call-to-action button within the selected time period.
A CTA button is an excellent opportunity to continue communication with your readers beyond the flipbook. Here are some ideas on how you can use a CTA button in your flipbooks:
- For direct contact—Contact us
- For additional information—Learn more
- For requesting a demo—Request demo, Book demo
- For showcasing a book preview—More info about the book, Request the whole book
- For selling products—Check out the whole collection
Read our Help Center article on how to add a Call-to-action button to your flipbooks.
See how you can use a CTA to invite readers to book a demo. The CTA is displayed in the top right corner of the flipbook.
FlippingBook Overview for Blog
Create yours
 #3 Views and Visitors
Views show the total number of times your flipbook link was opened. Visitors—the total number of different visitors that opened your flipbook.
Note that a single visitor might view your flipbook several times, and multiple other visitors might view it only once. For example, John opens your flipbook on Monday and he views it again on Tuesday. Mary opens your flipbook on Tuesday. This means that there are 3 views and 2 visitors. So if the number of views is considerably higher than the number of visitors, that’s a success! Your visitors get interested in your flipbook and return to read it.
And if you notice that the views peaked at some point, your readers might be sharing your flipbook with others. Don’t miss this chance and analyze what caused such a peak: did it occur after you updated your flipbook, shared it on social media, or embedded it into your website? Finding what caused the views to peak will allow you to understand how to generate even more views in the future and reach a wider audience.
 #4 Geolocation
Geolocation shows where the readers of your content come from: country, region, and city.
Geolocation stats allow you to analyze the geography of your audience by visitors and views and see what countries and regions drive the most traffic. These stats can serve as valuable data that will help you adjust your content to your specific readers, their interests, and time zones (for effective email campaigns). For instance, if you notice that you have many visitors from France, you can think of translating some of your flipbooks into French or covering more local French news and culture. Geolocation is available in FlippingBook Online Advanced, Team, and Enterprise plans.
 #5 Downloads and Prints
Downloads and Prints show you if a visitor downloaded or printed the full PDF or separate pages at least once per view.
For instance, if you send your pitch or presentation and then see that it was downloaded or printed, it’s a good sign! This means that your clients, partners, or investors got engaged with your idea or proposal and want to share your pitch or presentation with others.
Of course, some types of content such as learning materials, reports, or financial proposals need to be protected and Downloads and Prints will serve as red flags for them. But don’t worry! If you want to protect your content from unwanted sharing, just disable the print and download buttons, add a password, or use a protected embed.
 #6 Shares
Shares show if a visitor opened the Share dialog in your flipbook at least once per view on a desktop.
Shares show that a reader had the intent to share your flipbook not the fact that they actually shared it. Because people can share a flipbook via a direct link and we don’t track such interactions. And still, this metric can be useful as it tells you if your readers are interested in sharing your content: if a visitor takes time to find a Share button in the desktop version of your flipbook, it means they are very interested and determined to send your flipbooks to others!
 #7 Audience Engagement
Pages viewed show how many views each page got as well as the average number of pages read during one flipbook view. Time spent shows how long on average visitors spent reading your flipbook.
These two smart metrics can give you deeper insights into the performance of your flipbook and the ways your audience interacts with it. Audience Engagement is available in FlippingBook Online Advanced, Team, and Enterprise plans.
When you see that some pages get more views, and visitors spend more time reading them, you can understand what interests your readers the most and create more content on these topics. If you notice that some of the pages have less engagement, don’t fret! It only means that there is still some room for improvement, and you can rework and update the content on these pages to make them even better. We’ll give you some useful tips on how to do that later in the article. This way, you’ll be creating more quality flipbooks, filling every page with valuable and relevant knowledge. Why is quality content so essential? Because it brings new clients, nourishes loyal customers, and eventually increases sales.
Note: When someone views your flipbook on a desktop, they will see two pages at once. Therefore, in your stats, you’ll see half of the actual viewing time for both of the pages. For example, if someone looks at pages 5-6 for 10 seconds, then both pages get a 1-page view and 5 seconds of viewing time. However, if a flipbook is viewed on mobile in Portrait (vertical) mode then it's displayed as single pages. In this case, we are able to count each viewed page and the stats will be displayed for every single page.
If you want to enhance engagement with your flipbook, add interactivity to boost pages viewed and time spent reading them. Like in this engaging flipbook, for example:
Create yours
Embed a YouTube, Vimeo, or Wistia video
The vast majority of marketing professionals, 74%, say that videos bring in better numbers regarding ROI than simple static images. As reported by Hubspot, 83% of video marketers claimed that they had generated leads with the help of video content. In itself, a flipbook is already fresh and compelling interactive content—and when you add videos to it, you create an unrivaled immersive experience for your audience.
Add engaging GIFs
Businesses love to incorporate GIFs into their marketing content and use them to stand out among competitors and better connect with their audience visually. Because GIFs are great for storytelling and are the perfect medium to illustrate complex ideas. They make your content more humane and easy to read and raise engagement by up to 50% according to our experiment.
Pop-up images
Static images are already a thing of the past. Nowadays images are used to enhance the reader’s understanding of the material you’re covering. Adding various pop-up images on the pages of your flipbook helps you enrich your readers’ experience. A pop-up image becomes a clickable high-resolution preview that allows readers to study all the details of your visual.
 #8 Links
Links show the total number of clicks on external links within your flipbook in the selected time period.
Links are a great way to create an interactive bibliography or link back to your website, blog, and other useful resources. If you create catalogs, you can place links on your product images and lead your audience to your online shop so that they can buy the products they liked right away. Like in this lovely catalog:
Create yours
Analyzing links helps you learn what products are the most popular and put them up front on the cover or the first pages in the next issues of your catalogs to increase sales.
And if you create brochures or magazines and publish ads, you can add links there too. This way, you’ll be able to track how many clicks your ads got and give a full report to your advertising partners. Links are available in FlippingBook Online Advanced, Team, and Enterprise plans.
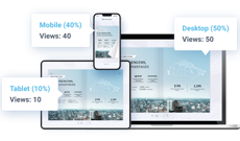
 #9 Devices
Devices show what percentage of readers view your content on desktops, phones, or tablets.
Knowing where your audience prefers to read your content gives you an amazing opportunity to optimize your documents for better viewing on different devices. For example, if your flipbooks are mostly viewed on desktops, you can add more interactivity, like high-quality videos and informative pop-ups, to create an immersive reading experience with your content. And if your readers mostly use mobile devices to view your content, you can create a clean and simple design and structure, use bigger fonts, and add bullet points instead of big chunks of text. Make sure to test how your content looks on various iOS and Android devices so that every viewer could access and read your flipbooks with ease.
 #10 Search Queries
Search queries show what people are searching for in your flipbook within the selected time period.
These metrics can give you valuable insights into the needs and interests of your audience. If you see that a certain keyword is a leader in search queries, it shows what people want to learn about in your flipbook. What’s more, if you see that people are searching for certain words that you talk about in your flipbook or, on the contrary, that are not present in your flipbook, it means that you should change the structure and improve the content to make it easier to read and navigate.
That’s it! We hope that our article helped you understand our Stats better and that you’ll be using all their benefits to the fullest.