Business reporting frequently breaks down at the final mile. Teams spend hours pulling numbers from various platforms, reconciling data across spreadsheets, and formatting charts, only for the final PDF attachment to sit unopened in a crowded inbox. Even when stakeholders do open the file on their mobile devices, static formats rarely translate well to mobile screens, making tables hard to read and summaries easy to overlook.
The process may seem complex, but with the right tools and a clear structure, it’s easier to manage. A well-organized workflow can help you bring your data together, turn it into a clear report, and deliver it in a format that’s easy for your audience to use.
To help you build a reliable workflow, this guide reviews tools that support each of the six stages of business reporting, from initial data collection to post-distribution reading analytics.
The 6 Stages of the Business Reporting Process
A structured business reporting workflow ensures that data moves reliably from raw logs to executive decisions. This lifecycle divides into six stages:
1.📥Data Collection: Extracting and consolidating numbers from marketing channels, internal databases, customer relationship management (CRM) systems, and financial software.
2. 🔍 Data Analysis: Cleaning, filtering, and modeling metrics to identify operational trends, cost drivers, and performance changes.
3. 📊 Data Visualization: Translating complex tables into intuitive charts, graphs, and summary dashboards.
4. 📝 Report Creation: Compiling analysis, visualizations, and written context into a cohesive document or presentation.
5. 📤 Report Publishing & Sharing: Distributing finished reports to internal teams or external clients using engaging and accessible formats.
6. 📈 Report Tracking & Performance Analytics: Evaluating how recipients interact with the document, including whether they opened it, how much time they spent reading, and which sections they focused on.
Let’s take a look at the reliable tools you can use at each stage of the reporting process
Stage 1: Data Collection Tools 📥
Before you can spot trends or evaluate performance, you must pull numbers from isolated platforms into a central workspace.
1. Supermetrics
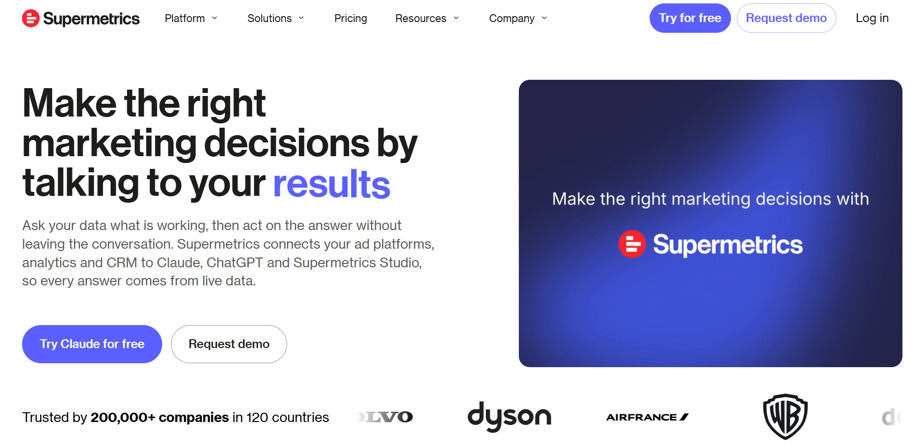
Supermetrics is an automated data pipeline tool designed to extract marketing, sales, and e-commerce data from over 100 platforms directly into spreadsheets, data warehouses, and business intelligence (BI) environments.
Best for: Performance marketers and agencies handling multi-channel campaigns.
Key features:
- Automated data transfers from ad networks, social channels, and web analytics tools.
- Direct connections to Google Sheets, Excel, BigQuery, and Looker Studio.
- Customizable scheduling options for automatic data refreshes.
Pros: Removes the need for repetitive CSV exports; supports a broad selection of marketing connectors.
Cons/ Limitations: Subscription costs scale up as you connect additional accounts and destinations.
Pricing: Tiered subscriptions based on destinations, data sources, users, and connected accounts; some plans start at €29/month when billed annually.
Why choose it? It simplifies daily marketing data consolidation by pulling multi-platform campaign data directly into your preferred analysis workspace.
2. Fivetran
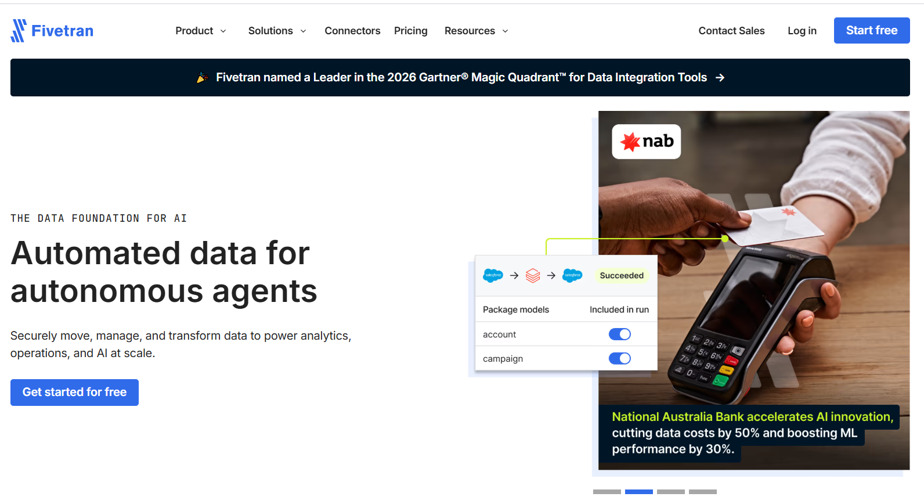
Fivetran is an automated data integration platform that extracts data from cloud applications, databases, and event logs, replicating it into cloud data warehouses.
Best for: Data engineers and technical analytics teams managing data warehouses.
Key features:
- Over 700 pre-built, fully managed data connectors.
- Automatic schema change detection and continuous data synchronization.
- Enterprise data governance and compliance management.
Pros: Manages pipeline maintenance and API updates automatically; supports high-volume database replication.
Cons/ Limitations: Requires technical familiarity with data warehousing infrastructure.
Pricing: Usage-based model calculated by monthly active rows (MAR), with a free tier available for low-volume accounts.
Why choose it? It centralizes disparate enterprise data sources into a warehouse without requiring teams to write and maintain custom extraction scripts.
💡 Pro tip: Standardize campaign naming conventions, date formats, currencies, and time zones across your marketing platforms before setting up automated data transfers. Consistent inputs make it much easier to combine datasets, compare channel performance, and avoid reporting discrepancies. 📥
Stage 2: Data Analysis Tools 🔍
After bringing your data together, you need environments where you can clean datasets, model scenarios, and calculate performance metrics.
3. Microsoft Excel/ Google Sheets
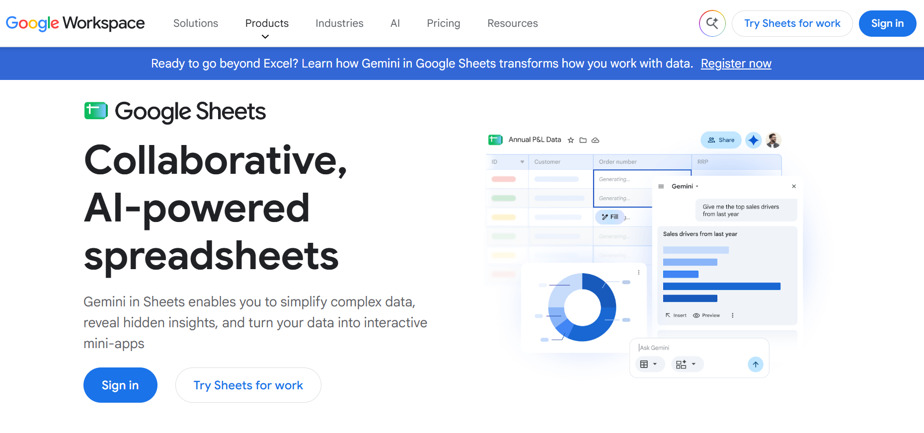
Microsoft Excel and Google Sheets are versatile spreadsheet applications used for data cleaning, custom formula modeling, and financial calculations.
Best for: Finance teams, operations managers, and analysts conducting ad-hoc data modeling.
Key features:
- Extensive formula libraries, pivot tables, and statistical modeling tools.
- Real-time collaborative editing in Google Sheets.
- Advanced data manipulation via Power Query and Python integration in Excel.
Pros: Broadly accessible across industries; adaptable to custom calculations and financial summaries.
Cons/ Limitations: Complex workbooks can be susceptible to manual formula errors and slow performance on massive datasets.
Pricing: Google Sheets is free with a Google account; Microsoft Excel is available standalone or through Microsoft 365.
Why choose it? It offers an accessible and flexible foundation for custom financial modeling and rapid data exploration.
4. Alteryx
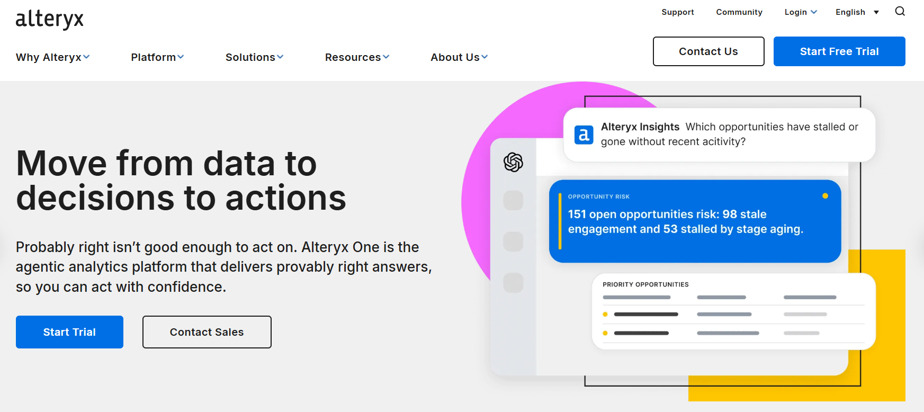
Alteryx is an analytics automation platform that allows business analysts to prepare, blend, and transform data using a visual workflow builder.
Best for: Operations analysts and data teams handling complex, repeatable data preparation workflows.
Key features:
- Visual, drag-and-drop canvas for joining, filtering, and transforming datasets.
- Pre-built tools for predictive, spatial, and statistical modeling without code.
- Automated workflow scheduling for recurring data hygiene tasks.
Pros: Replaces multi-step manual spreadsheets with clear, repeatable data prep workflows.
Cons/ Limitations: Carries a high licensing cost and requires dedicated onboarding to master advanced features.
Pricing: Annual enterprise licensing, typically starting around $5,195 per user per year.
Why choose it? It helps analysts automate complex data cleaning and transformation processes without writing code.
💡Pro tip: Keep raw data separate from cleaned datasets and document each transformation step. Whether you're working with spreadsheet formulas or automated Alteryx workflows, this makes your analysis easier to audit, troubleshoot, and update when new data arrives. 🔍
Stage 3: Data Visualization Tools 📊
Visual presentation helps readers understand trends, seasonal variations, and outliers faster than raw tables.
5. Google Looker Studio
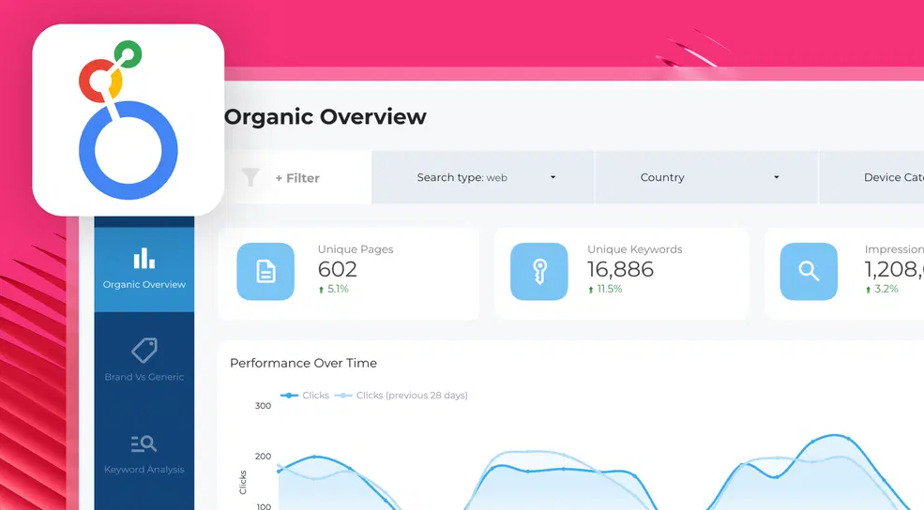
Google Looker Studio is a web-based visualization tool that connects to multiple data sources to produce interactive charts, scorecards, and shareable marketing dashboards.
Best for: Marketers, SEO specialists, and small businesses building web-based performance dashboards.
Key features:
- Direct data connections to Google Analytics 4, Google Search Console, and Google Ads.
- Interactive date filters, sorting controls, and dimension drill-downs.
- Community visualization library and report templates.
Pros: Free for standard use; integrates smoothly across the Google marketing stack.
Cons/ Limitations: Can experience slower load times when querying large datasets through third-party community connectors.
Pricing: Free; Looker Studio Pro is available for enterprise governance.
Why choose it? It provides an accessible way to create interactive charts, scorecards, and shareable dashboards without software licensing costs.
6. Tableau
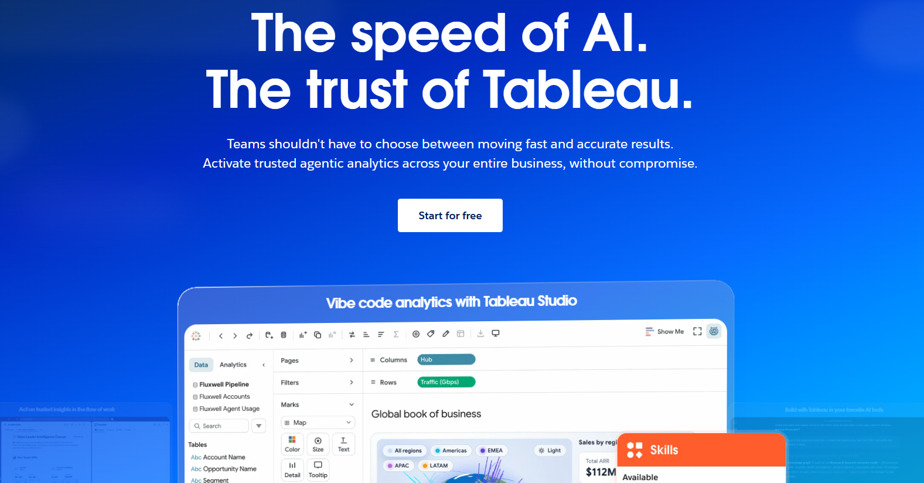
Tableau is an enterprise business intelligence platform built for deep data exploration and customized visual analytics.
Best for: BI professionals, data analysts, and enterprise teams evaluating complex data relationships.
Key features:
- Drag-and-drop visual interface for creating layered charts, geographic maps, and trend lines.
- Native connectors for major enterprise cloud warehouses and SQL databases.
- Advanced table calculations and interactive dashboard parameters.
Pros: Strong visual customization; handles large volumes of data smoothly.
Cons/ Limitations: Involves a significant learning curve and requires structured data preparation.
Pricing: Subscriptions start at $75 per user per month for Tableau Creator.
Why choose it? It gives analysts the depth needed to explore nuanced, multi-variable data trends in detail.
💡Pro tip: Structure your visual dashboards around 3–5 primary operational metrics per page. Presenting too many charts at once can obscure critical performance shifts and overwhelm the reader. 📊
Stage 4: Report Creation Tools 📝
Once numbers and charts are finalized, they need to be organized into a cohesive, structured deliverable with narrative context.
7. Canva
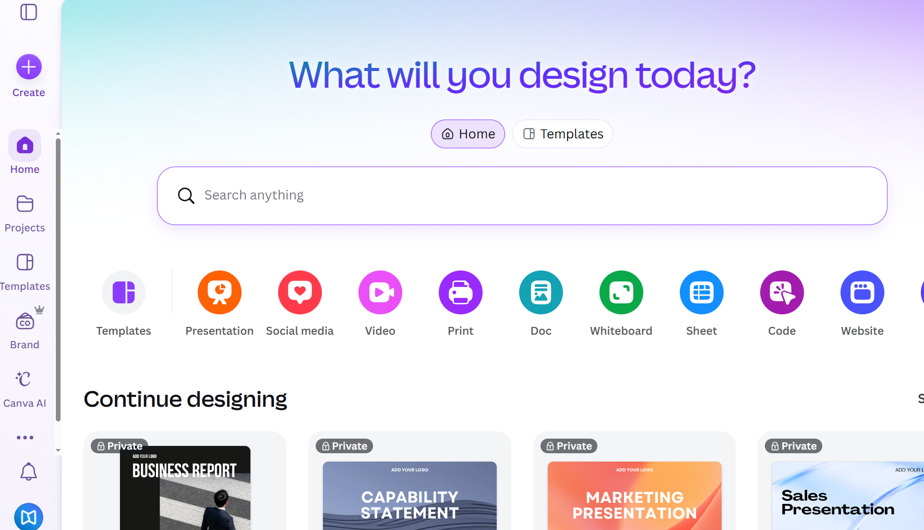
Canva is a web-based design platform that helps teams build professional presentation decks, annual report layouts, and multi-page business summaries.
Best for: Marketing teams and internal managers looking to create visually polished presentation decks without dedicated design staff.
Key features:
- Extensive library of document and presentation templates.
- Centralized Brand Kits for consistent typography, logos, and color palettes.
- Drag-and-drop tools for layout formatting and chart illustration.
Pros: Accessible interface; helps non-designers produce clean, branded reports quickly.
Cons/ Limitations: Does not dynamically refresh live database metrics; data snapshots must be updated manually or uploaded via CSV.
Pricing: Free tier available; Canva Pro starts at $15/month per user.
Why choose it? It simplifies the design process, making it easy to turn dry performance numbers into well-structured visual presentations.
8. AgencyAnalytics
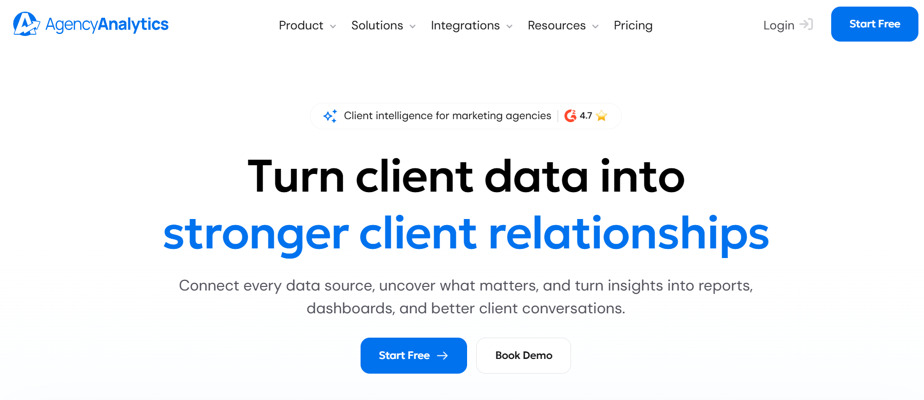
AgencyAnalytics is a client reporting platform that automates multi-channel marketing report compilation for agencies.
Best for: Digital marketing agencies managing recurring reporting across multiple client accounts.
Key features:
- Automated data integrations across SEO, PPC, social media, and call tracking tools.
- Drag-and-drop report builder with custom white-label branding.
- Scheduled report delivery with optional client approval steps.
Pros: Substantially reduces manual compilation time by pulling multi-channel marketing data into unified reports.
Cons/ Limitations: Customization is primarily focused on digital marketing layouts rather than general corporate reporting.
Pricing: Starts at $20 per client per month when billed annually.
Why choose it? It automates the recurring assembly of monthly marketing reports across multiple client accounts.
💡Pro tip: Build a reusable report template with the same core sections: an executive summary, key performance metrics, notable changes, and recommended next steps. Keeping a consistent structure across reporting periods makes it easier for stakeholders to track progress, spot trends, and turn insights into action. 📝
Stage 5: Report Publishing & Sharing Tools 📤
Distributing your report via email attachments often runs into practical issues, including spam filters, strict file size limits, and awkward mobile formatting. So you need tools to present your reports in a professional and easy-to-read format.
9. FlippingBook
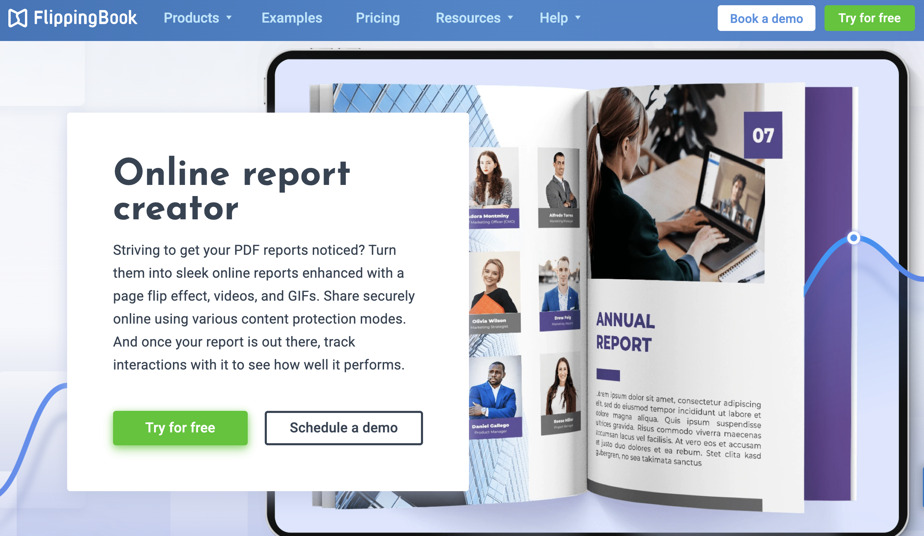
FlippingBook is a digital publishing platform that converts static PDF documents into interactive, web-based digital publications that can be shared via direct links.
Best for: Marketing managers, financial analysts, and consultants who want to distribute clean, branded reports that open smoothly on any device.
Key features:
- Direct conversion from PDF documents into web-based digital publications that are easy to view and navigate on both desktop and mobile.
- Simple share links that let recipients open the report in a browser without downloading the PDF first.
- Updating a PDF under the same link, so that your readers always have the latest documents at hand, no need to resend anything
- Interactive options to embed videos, animation, clickable navigation links, and pop-up images to make reports more engaging and easier to explore.
- Privacy features include password protection, access via email or SSO, and private embeds.
- Branding allows you to customize your report with your logo, colors, and background, then share it through a branded link. Keep your reports consistent with your visual identity and make every piece of communication feel unmistakably yours.
Pros: Eliminates the hassle of large email attachments; offers a smooth reading experience on mobile devices and desktop screens.
Cons/ Limitations: Requires an existing PDF to upload and publish.
Pricing: Free trial available; paid plans scale based on features and hosting volume.
Why choose it? FlippingBook helps you make reports more accessible, engaging, and professional. Readers get a smoother experience on any device, while you get branded sharing, interactive content, and one link you can keep using as your report evolves.
Want to see a digital annual report in action? See how the flipbook format turns a detailed, information-heavy report into an online publication that’s easy to browse and explore.
The Christie NHS Trust Annual Review
Want to create an interactive report?
💡 Don’t have a PDF yet?
Check out the free report templates: customize them in Canva and send directly to FlippingBook to enhance with interactivity!
|
|
|
|



10. Microsoft SharePoint
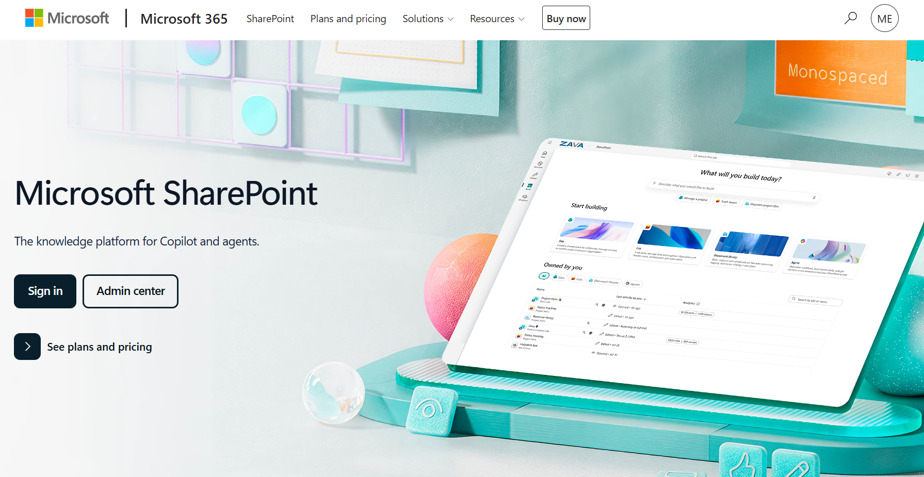
Microsoft SharePoint is a cloud document management and collaboration platform used to store, organize, and control access to internal organizational files.
Best for: Internal corporate teams that require strict access management, versioning, and compliance oversight.
Key features:
- Access permissions managed through Microsoft Entra ID.
- Automatic version history tracking and document check-in/check-out controls.
- Integration across Microsoft 365 applications.
Pros: Secure access controls; provides a central repository for internal operational archives.
Cons/ Limitations: Can be complex to configure for smooth external sharing with clients who lack Microsoft accounts.
Pricing: Included in Microsoft 365 commercial plans, or as a standalone service from $5 per user per month.
Why choose it? It serves as a secure, centralized storage environment for sensitive internal audits and board materials.
💡Pro tip: Choose your publishing format based on who needs to read the report and how they’ll access it. For external audiences, prioritize easy browser access, mobile-friendly layouts, and branded presentation. For sensitive internal documents, focus on access permissions and version control. Always test the final sharing experience before sending the link. 📤
Stage 6: Report Tracking & Performance Analytics 📈
Once a report is shared, tracking engagement data helps you understand whether stakeholders actually read it or simply saved it for later.
11. FlippingBook (Document Tracking Features)
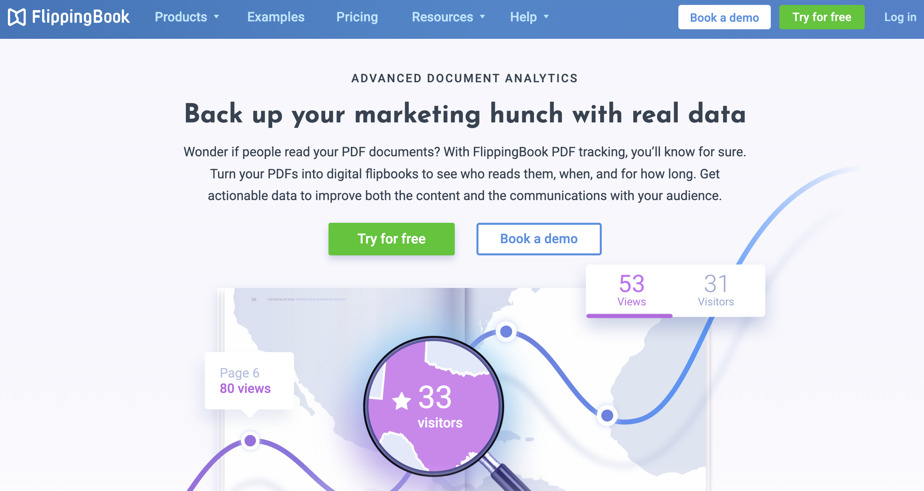
In addition to digital publishing, FlippingBook includes built-in document tracking features that give teams visibility into how recipients interact with their reports.
Best for: Account managers and strategists who want to know how clients and executives engage with their reports.
Key features:
- Unique trackable links to monitor individual recipient opens and viewing sessions.
- Page-level statistics showing total page views and average time spent on each page.
- Outbound link click monitoring for references and calls to action.
- Email notifications when someone opens a trackable link.
Pros: Removes the guesswork around whether a deliverable was reviewed; highlights which sections captured the reader's attention.
Cons/ Limitations: Detailed analytics features depend on the specific subscription tier.
Pricing: Basic analytics и trackable links are available in all plans.
Why choose it? FlippingBook analytics lets you see how many people viewed your report and which content attracted the most attention, so you can tailor your follow-up communication accordingly.
12. Google Analytics 4 (Custom Web Event Tracking)
Google Analytics 4 (GA4) is a web analytics platform that tracks user interactions, downloads, and custom event behavior across web properties and hosted reporting portals.
Best for: Organizations hosting reports on public websites or dedicated web portals.
Key features:
- Event tracking for page navigation, button clicks, and outbound link referrals.
- File download event logging when users click to download hosted assets.
- Audience segmentation based on geographic region, device type, and referral source.
Pros: Provides in-depth visitor data across web-hosted content; free to implement on digital properties.
Cons/ Limitations: Requires GA4 to be actively implemented on the hosting website; does not track offline or emailed static files.
Pricing: Free standard tier; Analytics 360 available for enterprise deployments.
Why choose it? It tracks reading journeys and download actions when publishing annual reports or market studies directly on a website.
💡Pro tip: Review page-level reading times before client check-ins. If your analytics indicate a client spent several minutes on your strategic recommendations page but skimmed the channel metrics, you can focus the conversation directly on strategy rather than reviewing basic numbers. 📊
How to Choose the Right Reporting Tools 🎯
Selecting the right software depends on where bottlenecks occur in your current process:
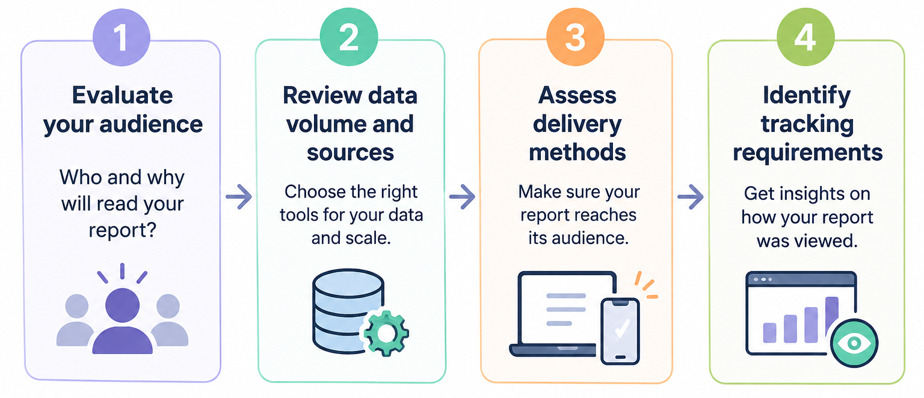
1. Evaluate your audience: Internal analysts often need the raw modeling flexibility of Excel or Alteryx, while clients and leadership teams benefit from the clean presentation of Canva and the accessible delivery of FlippingBook.
2. Review data volume and sources: If you manage dozens of ad accounts, automated connectors like Supermetrics save significant manual effort. For complex multi-system databases, consider an integration platform like Fivetran.
3. Assess delivery methods: If recipients read reports primarily on mobile devices, or if email servers reject heavy attachments, moving to link-based digital publications solves practical delivery issues.
4. Identify tracking requirements: If you need to verify whether a proposal or report was reviewed before a meeting, prioritize tools that provide page-level reading metrics.
Frequently Asked Questions
1. What software is commonly used for business reporting?
Different tools support different stages of the process. Spreadsheets like Microsoft Excel and Google Sheets remain standard for data analysis and financial summaries. Dashboards like Google Looker Studio and Tableau handle data visualization, while platforms like Canva and AgencyAnalytics assist with document layout. For distributing reports as accessible web links and reviewing page-level engagement, teams often use digital publishing platforms like FlippingBook.
2. What is management reporting?
Management reporting is the practice of gathering, analyzing, and presenting operational data to company leaders to support strategic business decisions. Unlike standardized financial statements prepared for regulators, management reports focus on internal efficiency, department performance, and forward-looking operational plans.
3. How can businesses share reports securely?
Teams can protect sensitive business reports by using cloud-based sharing tools that support permission management. Options such as password protection, restricted embedding domains, user authentication via enterprise directories, and turning off search engine indexing ensure that only authorized stakeholders can access the document.
Final Thoughts
A good reporting workflow allows you to do more than just pull numbers into a spreadsheet. It means moving data efficiently from collection and analysis to clear, measurable delivery. By pairing reliable data integration and analysis tools with accessible, browser-based report formats, you save time during compilation and make it easier for stakeholders to review your findings. Taking a structured approach to each of these six stages helps ensure that your reporting leads to informed, timely business decisions.
Author's bio